

I'm Quite Ready for Another Adventure
As part of my transition to Data Science I figured I should get some first hand experience into the field in which I'm transitioning. A few months ago I got an email about a Data Science conference in San Diego so I looked in to it and saw that they were offering a bootcamp. I figured it would be worth it since it was fairly nearby. It was a bit scary going in since I've never been to a conference where I literally did not know or had never even seen a single person there. Nonetheless, here is an overview of the bootcamp (quite delayed at this point).
Am I dreaming?
When I arrived in San Diego for the bootcamp I had just finished reading "Player Piano" by Kurt Vonnegut, which is a book about a future in which machines (a bit more analog than our current future but still...) had taken over most jobs and the only real jobs left were for the engineers and managers. Everyone else is relegated to meaningless public works jobs or the military. Anyhow, the main character eventually gets caught up in a revolution to stop the machines and give the jobs back to humans. Eventually the revolution fails with revolutionaries building their own machines all over again; meanwhile the leaders of the revolution give up understanding that maybe it was enough just to try resistance for the record.
Anyway, this is relevant because my first look in to this new data science / business world was a keynote talk entitled "Replacing Middle Class Factory Jobs with Machine Learning". At first I thought that maybe it would be about training more people about machine learning but no, it was actually about replacing people with machine(s) (learning). However, despite the dubious setup in my mind the talk was quite interesting and even a bit inspiring.
For the most part the talk described how combinations of neural networks and genetic algorithms could create schedules for thousands of factory workers, how a support vector machine (with some additional hardware) could predict the failure of certain products, and how more neural networks could eliminate the need for humans in quality assurance. However, for each of these innovative and technical solutions came social problems. For instance, the new ML scheduler still needed human intervention at the end but the woman who had previously been making the schedules for 30 years quit because she felt that she had lost her purpose. The fancy support vector machine was tricked by factory workers gaming the system to get more products approved, and the replacement of half of the work force with neural networks led to lower productivity because the workers responsible for assembly lost their quality assurance work mates (they would work in teams).
Sounds terrible, I know, but this talk was partially a cautionary tale about ignoring the human consequences of further automation (which is inevitable). In fact in many of the instances above, workarounds were found to increase communication between the workers and the new ML systems and their "engineers". One case which I liked was the one in which the factory workers missed having someone to talk to while working. The solution to this was to simply rotate their stations so that they could talk to the other workers assembling the materials. Furthermore, they added an element of competition by adding leader boards and giving out bonuses based on this. In this case productivity increased (over pre-ML levels) and worker satisfaction was higher.
So in the end I got a handle on the sociological and machine learning aspects of factory automation with a lesson that people are not machines and that we will always be better off when we work together. And that was just the first hour!
Data Science Bootcamp Day 1
Day 1 consisted of two sections: "An Overview of Data Science" and "Data Sourcing and Preparation". For the most part these two sessions covered similar material; however the first session was much more interesting. The speaker for the first session has been doing data science (or data mining or predictive analytics) for 20 years and he had many examples working with the New York Times to improve subscription rates, working with the Canadian Tax Agency to spot tax evaders and other tax fraud, working with other companies to predict customer behavior (think Amazon). In the second session, the speaker had more limited experience, mainly climate data and some image tagging work.
The introduction section began by describing the differences between statistics, business intelligence (BI), predictive analytics, and data science. In brief, statisticians are very worried about parametric modeling and how that model fits the data. To the statistician, the model is the king. BI analysts focus on data but are most interested in key findings (i.e., summary of sales, or turnover rates in factories). Both predictive analytics and data science deal with using data to make predictions about future behavior. Data scientists are more code-centric, mostly programming in R or Python making use of SQL databases and scalable platforms like Hadoop, whereas predictive analytics deals more with proprietary GUI-like interfaces and less cutting-edge algorithms.
After this introduction, the two sessions largely dealt with CRISP-DM (CRoss-Industry Standard Process Model for Data Mining),
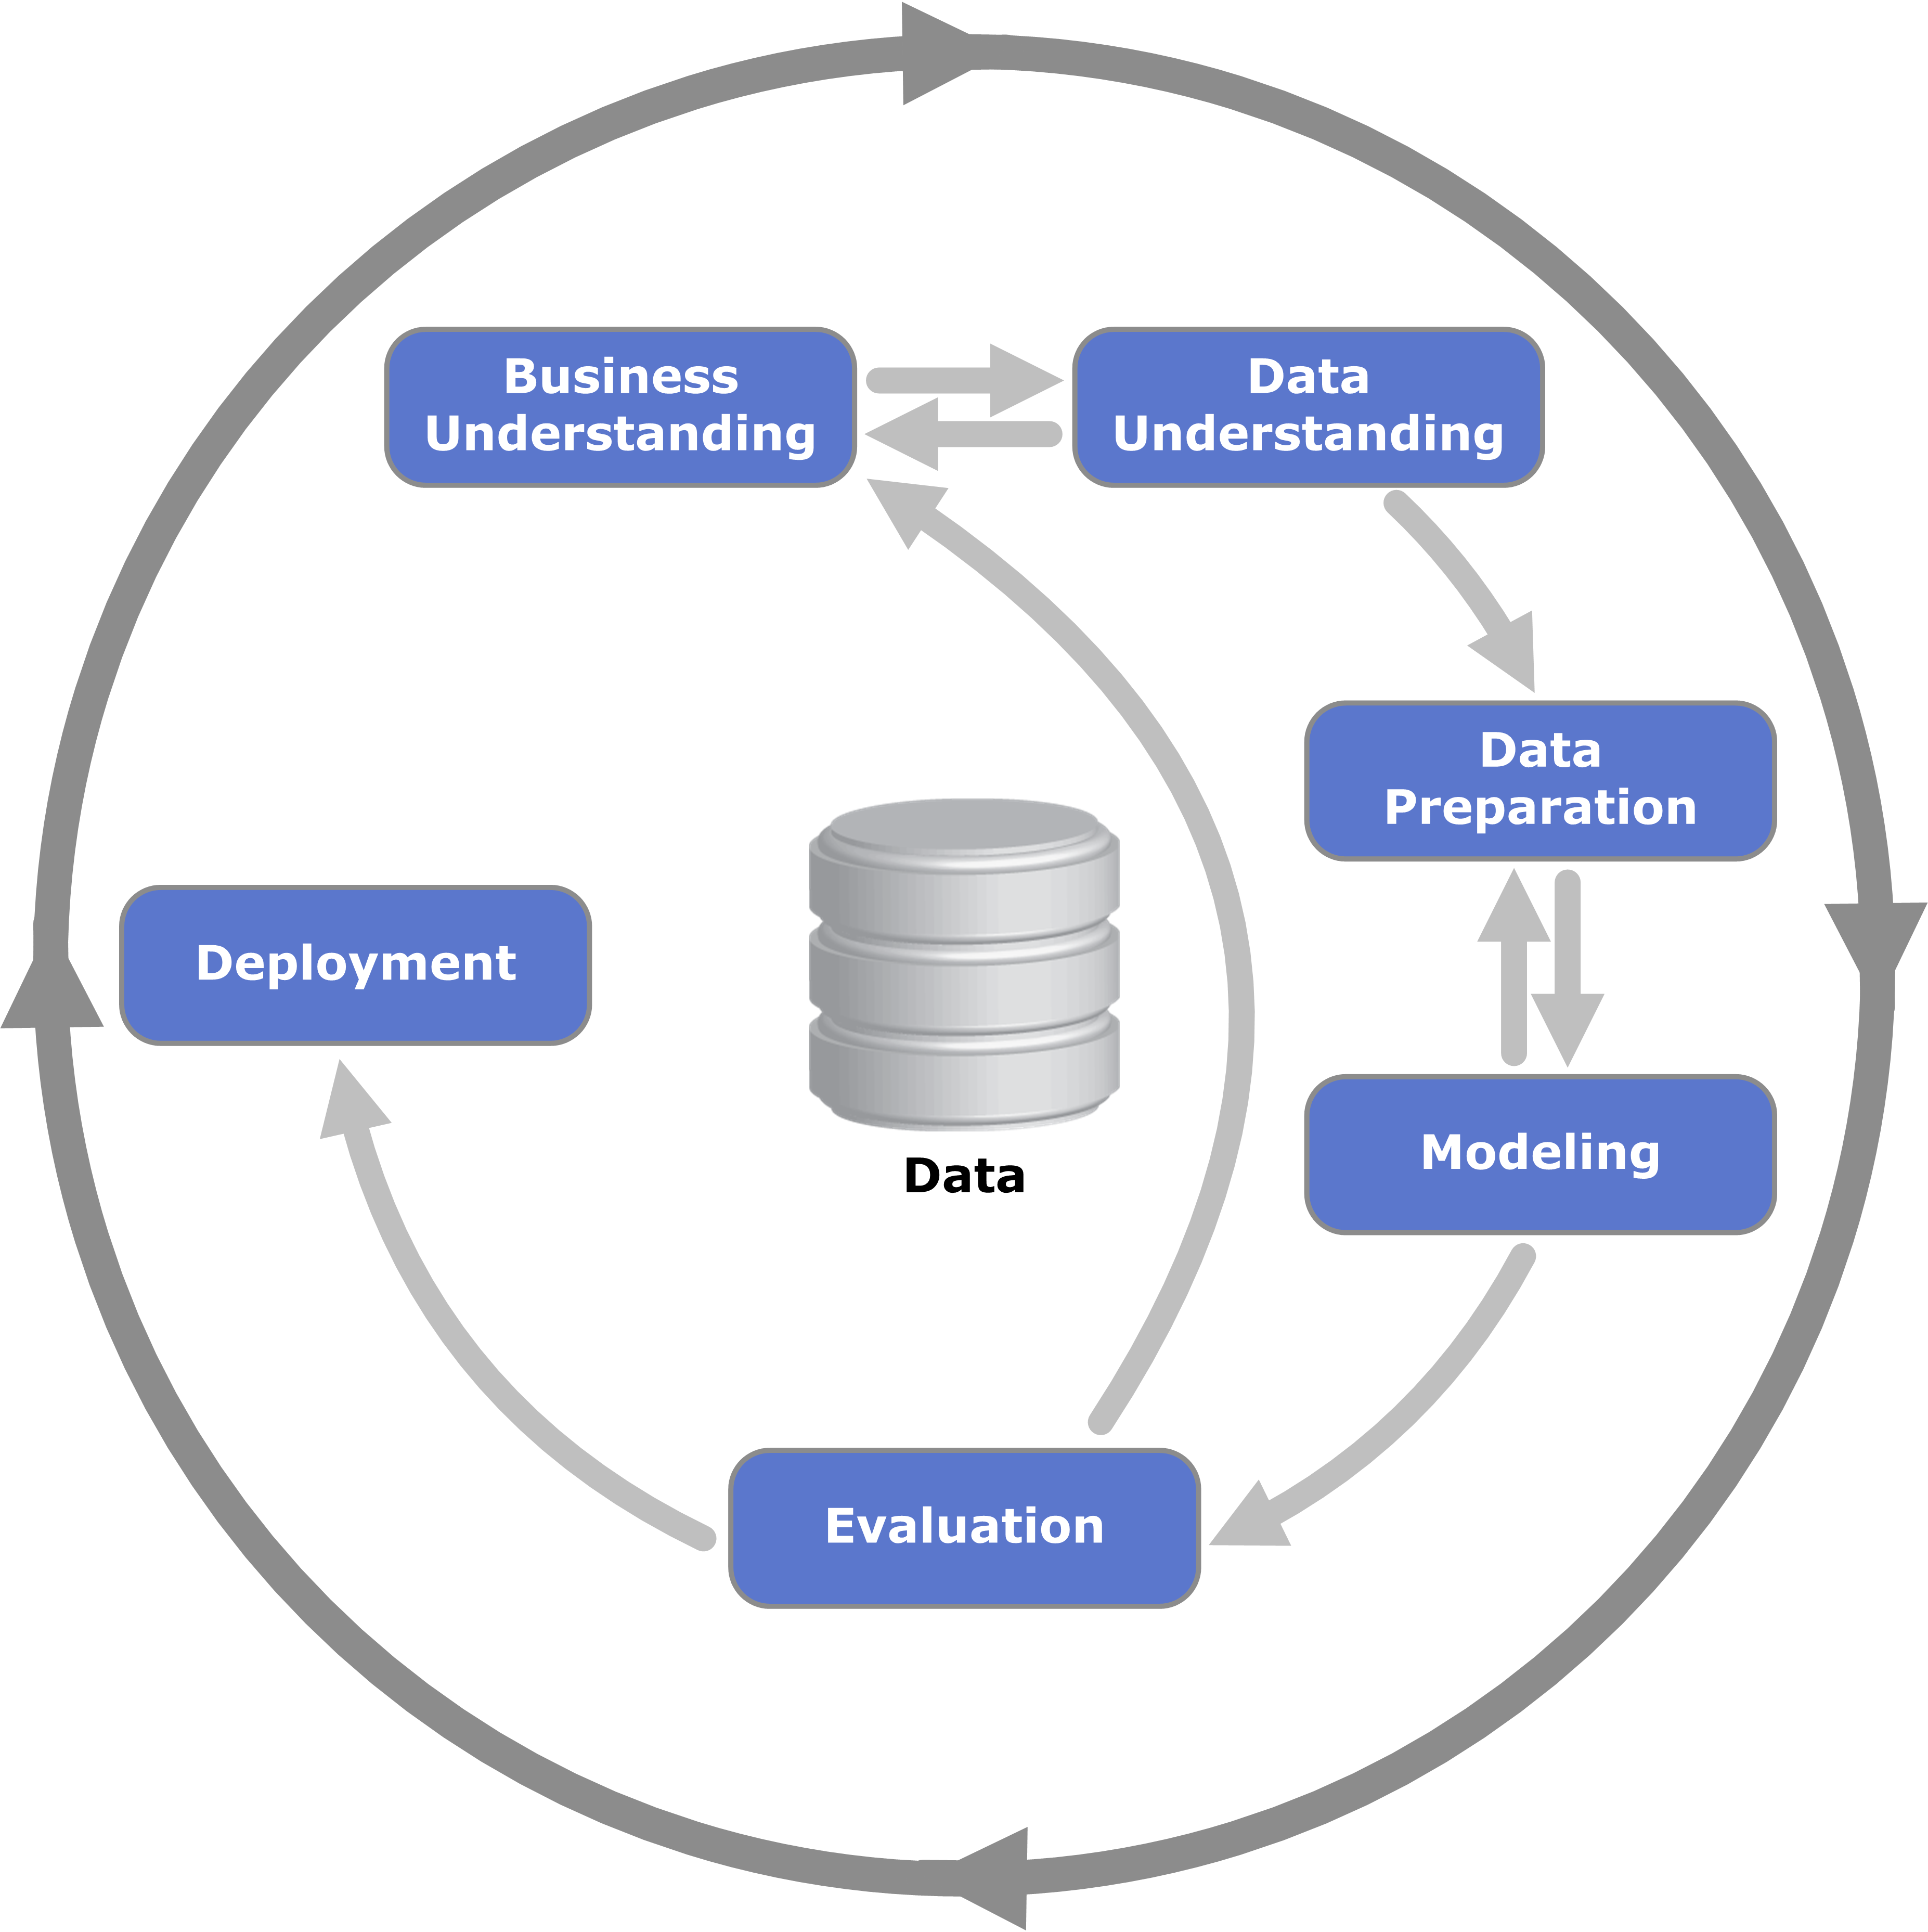
which describes the process cycle that many data scientists go through. Most of the sessions were focused on the Data Understanding and Data Preparation steps as in many cases 90% of the work lies there. A quick summary of the steps is as follows
-
Business Understanding
- This is the step where data scientists talk with people that are familiar with the problem that you are trying to solve. These people are also called domain experts. There will be iteration with this group as you explore the data (i.e., why are there missing values, are outliers understood, etc) and define objectives.
-
Data Understanding
- This is probably the biggest task (in combination with data prep) in the cycle. Here data scientists explore distributions of the features, look for missing values, look for outliers, explore the mix of continuous, categorical, and/or cardinal variables. Essentially this involves making lots of plots and summary statistics, which depending on you, can either be fun or incredibly tedious.
-
Data Preparation
- This is the step where we decide what data we are going to use, remove redundant variables, replace missing values (mean, median, distribution, etc), transform features (log, binning, encoding of categorical features), and create new features (ratios, differences, etc.).
-
Modeling
- What kind of algorithm? Supervised vs Unsupervised? Categorical target vs continuous target? Do we want to understand how the features impact the prediction or do we just care that the prediction is correct (i.e. decision trees vs neural networks)?
-
Evaluation
- What are we trying to optimize? This is where cross-validation and testing of the model happens. The fitness of the model is very dependent upon the objective.
-
Deployment
- This is where everything is put together. Where will the model be deployed, how will it be maintained, how often will the model be re-trained? Does it need to be optimized in a different language or will it work in the original modeling language?
Overall, these sessions were quite helpful in understanding how professionals approach data science problems. I was pleasantly surprised that I actually followed most of these steps instinctively when playing around with my own small data science problems!
Data Science Bootcamp Day 2
Honestly, day two of the bootcamp was more useful personally than it was practically. The morning session was just a review of basic supervised and unsupervised learning techniques like linear regression, decision trees, and k-means clustering; all of which I have already seen quite a bit before. However, over lunch I managed to start a few conversations with a pretty wide range of people who work in the tech industry, manufacturing, and public utilities. I learned that BI means Business Intelligence and I further learned that business intelligence basically means that you create data dashboards and other visualizations that summarize data that has been collected by the company. I further learned that in many data science groups one can earn quite a large bonus if they recommend a person that is then hired; so I may be less bashful in asking for help in the future.
The last session focused mostly on how data science teams actually work. I was happy with this session because in the few examples shown they used Jupyter Notebooks, which are a personal favorite of mine. I also liked that they focused on time-series analysis a bit more than the other presenters, mentioning that time-series analysis is often an overlooked skill that can add real value to data science groups. Good news for me! This session also introduced me to Agile Software Development which seems extremely useful and made me a bit envious that we are not organized enough to use this in academia. Lastly, the group who ran this session has Github page with a lot of awesome tutorials and tools.
So as I left the bootcamp I literally thought to myself "I'm quite ready for another adventure!".
Leave a Comment